Good Conversion Rate Guide
When we talk about a Good Conversion Rate for an eCommerce business, we’re really talking about the Key Performance Indicators (KPIs) that show how effectively your online store turns visitors into revenue.
It’s not enough to drive traffic; you need to know whether that traffic is converting. A “good” conversion rate depends on your niche, product pricing, customer journey, and the quality of your traffic — but in most markets, serious brands aim to move from the typical 2–4% range toward high-performing funnels that consistently outperform competitors.
Your website isn’t just a brochure with pretty visuals and themes. Its real job is to convert visitors into buyers who complete the journey from first click to checkout. Conversion rate is the percentage of visitors who take a key action (usually a purchase), and it’s the sharpest way to measure how effective your offers, UX, and messaging actually are.
What Does “Good” Actually Mean for eCommerce Conversion Rates?
There’s no single magic number. A good conversion rate for eCommerce depends on:
- Product type and price point – Higher-ticket products usually see lower conversion but higher AOV.
- Traffic quality – Cold social traffic converts differently from high-intent search or email traffic.
- Customer journey maturity – Do you have proper retargeting, email, and SMS follow-up in place?
- UX and trust signals – Page speed, mobile experience, reviews, guarantees, and clarity of offer.
Instead of chasing a universal number, you should track:
- Your current baseline conversion rate
- Conversion by traffic source (Meta, Google, email, etc.)
- Conversion by device (desktop vs mobile)
- Conversion at each funnel stage (view → add to cart → checkout → purchase)
Want a benchmark for your niche?
Explore how we structure funnels and KPIs for different verticals in our eCommerce industry blueprint and fashion & apparel growth playbook.
Understanding the eCommerce Conversion Funnel
Every “good conversion rate” is built on smaller micro-conversions inside your funnel. Typical metrics include:
- Add-to-Cart Rate – % of visitors who add at least one item to cart.
- Checkout Initiation Rate – % of visitors who begin checkout.
- Purchase Conversion Rate – % of visitors who complete a purchase.
- Repeat Purchase Rate – % of customers who buy again in a defined window.
- Subscription or List Sign-Up Rate – % of visitors who join your email/SMS list.
Each of these metrics answers a different question:
- Is my offer and product page compelling enough? (Add-to-cart, product views)
- Is my checkout flow smooth and trustworthy? (Checkout initiation & completion)
- Is my post-purchase journey effective? (Repeat purchases and CLV)
All of these are parts of your overall Good Conversion Rate story — not just “how many orders did we get this month.”
What We See in Real Campaigns: Technovier Case Study Patterns
Across different verticals, the fastest conversion lifts rarely come from one single trick. They come from aligning traffic, offer, and automation into one system. A few examples from the Technovier case study library:
- In our unified e commerce retail strategy for a sports retail brand, we show how aligning in-store promotions with online funnels helped turn sporadic buyers into repeat customers.
- Our Instagram ads & influencer campaign for a beauty eCommerce brand highlights how creative testing plus structured funnels helped turn social attention into measurable revenue.
- In the luxury streetwear performance campaign, the focus was on storytelling, scarcity, and drops — all of which deeply impact conversion behavior for premium fashion brands.
While each business is different, the pattern is the same: brands that intentionally design acquisition + nurture + remarketing see compounding improvements in their conversion rates over time.
Want to see how this looks when product pages, ads, email, and automation are designed together?
Review our Ecom Growth Funnel Engine package for a full-funnel view.
How to Calculate Your Conversion Rate
The basic purchase conversion rate formula is simple:
Conversion Rate (%) = (Number of Conversions ÷ Total Visitors) × 100
For example:
- 10,000 visitors in a month
- 300 total orders
- Conversion rate = (300 ÷ 10,000) × 100 = 3%
You can track this via tools like Google Analytics, your eCommerce platform dashboard, or custom reporting inside a CRM stack.
Diagnosing a Low Conversion Rate
If your numbers feel “stuck”, start by asking:
- Is my traffic aligned with my offer? – Are you targeting the right intent level with the right landing page?
- Is my value proposition obvious in 5 seconds? – Above-the-fold clarity on what you sell, for whom, and why now.
- Is my UX helping or hurting? – Slow site, cluttered layout, poor mobile experience, or hidden shipping costs will all hurt conversion.
- Do I have enough trust signals? – Reviews, testimonials, guarantees, clear returns, and secure payment badges.
- Is my checkout flow simple? – Fewer fields, clear progress, guest checkout, and multiple payment options.
- Do I follow up properly? – Abandoned cart flows, browse abandonment, and post-purchase sequences.
Many of these can be uncovered using behavior reports — scroll depth, click maps, page speed, and device-level performance. Together they give a live picture of your website performance and where friction is hiding.
Improving Conversion Rate: From Guesswork to Systems
Serious conversion rate optimization (CRO) starts when you stop guessing and start testing. A structured CRO approach usually includes:
- Traffic quality checks – Align creatives, audiences, and landing pages across channels like Meta ads and Google Ads.
- Landing page and product page experiments – Headlines, imagery, social proof, pricing displays, and CTAs.
- Checkout optimization – Removing distractions, reducing form fields, clarifying shipping and returns.
- Lifecycle flows – Using business automation and CRM to recover abandoned carts, win back old customers, and increase CLV.
- Technical SEO & performance – Site speed and search visibility via SEO optimization.
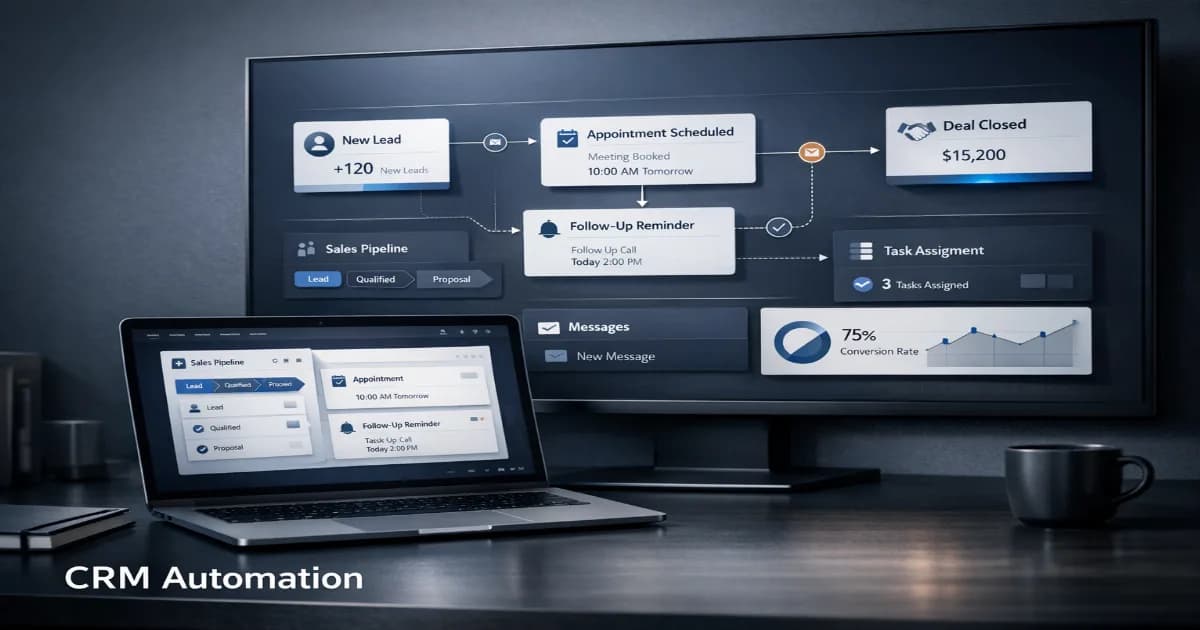
All of this is easier when your store isn’t operating in isolation but is plugged into a central Technovier CRM record that tracks every touch from ad click to repeat purchase.
Setting Baselines and Targets for Your Store
Before you optimize, you need a baseline. That means:
- Documenting your current overall conversion rate
- Breaking it down by traffic source and device
- Recording add-to-cart, checkout start, and purchase rates
- Noting your average order value (AOV) and repeat purchase rate
From there, set realistic tiered targets for the next 6–12 months rather than chasing instant “10% conversion rate” dreams:
- Stage 1: Fix obvious UX/offer issues, stabilize tracking
- Stage 2: Implement lifecycle automation and retargeting flows
- Stage 3: Systematic A/B testing on key pages and offers
- Stage 4: Scale traffic into what’s already working
Not sure where your funnel is leaking?
Our Automation Readiness Assessment and conversion focused build packages help you map baseline → target with clear priorities.
From “Good Enough” to Compounding Growth
Many brands obsess over a single number – “Is my conversion rate good?” – instead of asking a more powerful question:
“Is my system designed to improve conversion rate every month?”
When your ads, store, CRM, and automation are stitched together, conversion rate becomes a lever you can reliably improve, not a number you just react to. That’s the shift we focus on in our eCommerce strategy case studies and growth packages.
Ready to turn your store into a conversion engine?
Start with a strategy session or walk through our Ecom Growth Funnel Engine and see how we design funnels, automation, and CRO as one stack.