More property inquiries can look like progress while the sales calendar stays flat. A lead report counts people who entered a form or called. A meeting report counts a later, narrower event. When those two reports use different date windows or definitions, the apparent gap can be misleading. When they use the same rules and the gap persists, the team has a specific funnel problem to investigate.
Property lead quality is therefore a measurement question before it is a campaign verdict. A founder needs to know how much was spent, how many distinct inquiries became qualified opportunities, and how many of those opportunities reached a defined meeting stage. The useful comparison is an acquisition cohort observed for a consistent amount of time, with the same qualification and meeting rules in every period.
Define the stages before comparing months
A property inquiry can be a form submission, phone call, chat, or platform lead. Count distinct people or inquiry records under a written deduplication rule. A qualified opportunity is a smaller set that meets documented criteria such as location, property type, budget range, and purchase or rental intent. A recorded meeting is another stage: it may mean a booked consultation, a confirmed viewing, or an attended appointment. Pick one meaning and keep it stable. A booked meeting should never be presented as an attended meeting.
The difference between marketing-qualified and sales-qualified leads is relevant here. Marketing interest alone does not show that a person is ready for a sales conversation. The CRM should preserve when the inquiry arrived, when it was qualified, who owned it, and when it entered the meeting stage. Without that event history, a dashboard can report today's status but cannot reliably reconstruct what a monthly cohort did after acquisition.
For each cohort, name the denominator and period:
| Measure | Calculation | What it answers | Important limit |
|---|---|---|---|
| Cost per inquiry | Ad spend in the acquisition period ÷ distinct inquiries acquired in that period | What did initial response cost? | It does not measure fit or meeting outcomes. |
| Opportunity rate | Qualified opportunities from the inquiry cohort ÷ distinct inquiries in that cohort | What share met the qualification rule? | It changes if the rule or deduplication process changes. |
| Meeting-stage rate | Opportunities that reached the chosen meeting stage within the observation window ÷ qualified opportunities in the same cohort | What share advanced after qualification? | It is not an attendance or sale rate unless those stages are explicitly counted. |
| Cost per recorded meeting | Ad spend for the acquisition cohort ÷ that cohort's recorded meetings within the observation window | How much spend corresponds to one recorded meeting? | Other channels and follow-up work may also influence the outcome. |
These are descriptive ratios. They do not prove that advertising caused a meeting or that one channel deserves all the credit. If a property buyer encountered several campaigns, attribution needs its own documented rule.
Compare mature cohorts, not incomplete calendar snapshots
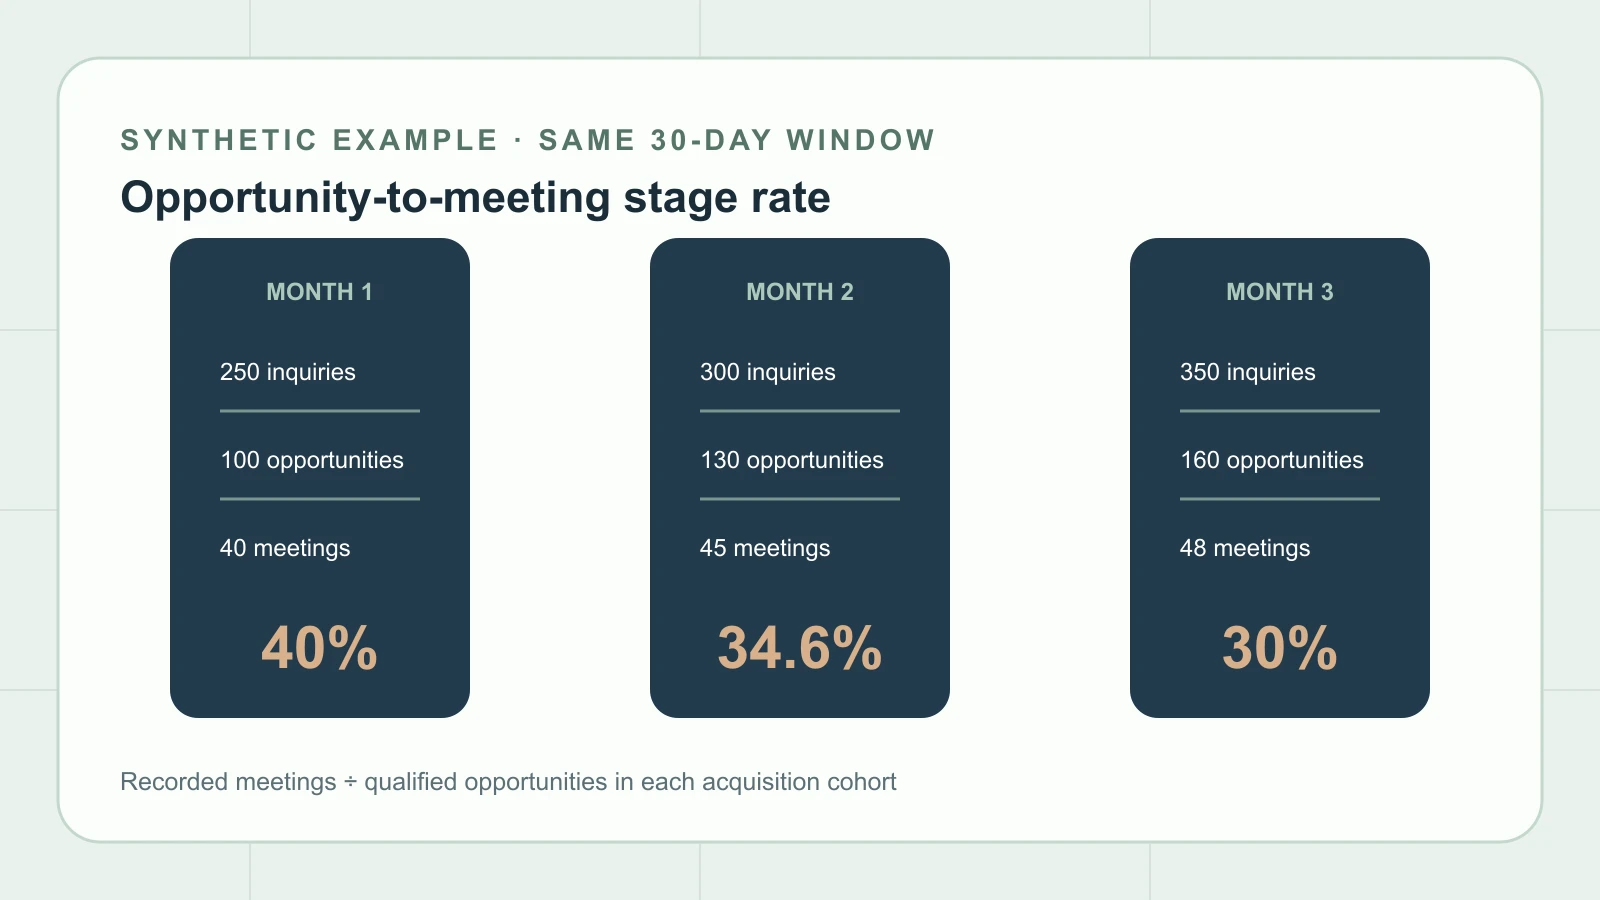
The table below is a synthetic example, created to show the calculation. It is not client performance, a Technovier result, or a benchmark. Imagine three equal-length monthly acquisition periods. Each cohort is evaluated 30 days after its final inquiry entered the CRM. The qualification rule, deduplication rule, meeting-stage definition, spend currency, and attribution method stay the same. Every number is illustrative.
| Synthetic acquisition cohort | Ad spend | Distinct inquiries | Qualified opportunities | Recorded meetings within 30 days | Opportunity rate | Meeting-stage rate | Cost per recorded meeting |
|---|---|---|---|---|---|---|---|
| Month 1 | $5,000 | 250 | 100 | 40 | 100 ÷ 250 = 40% | 40 ÷ 100 = 40% | $5,000 ÷ 40 = $125 |
| Month 2 | $7,000 | 300 | 130 | 45 | 130 ÷ 300 = 43.3% | 45 ÷ 130 = 34.6% | $7,000 ÷ 45 = $155.56 |
| Month 3 | $10,000 | 350 | 160 | 48 | 160 ÷ 350 = 45.7% | 48 ÷ 160 = 30% | $10,000 ÷ 48 = $208.33 |
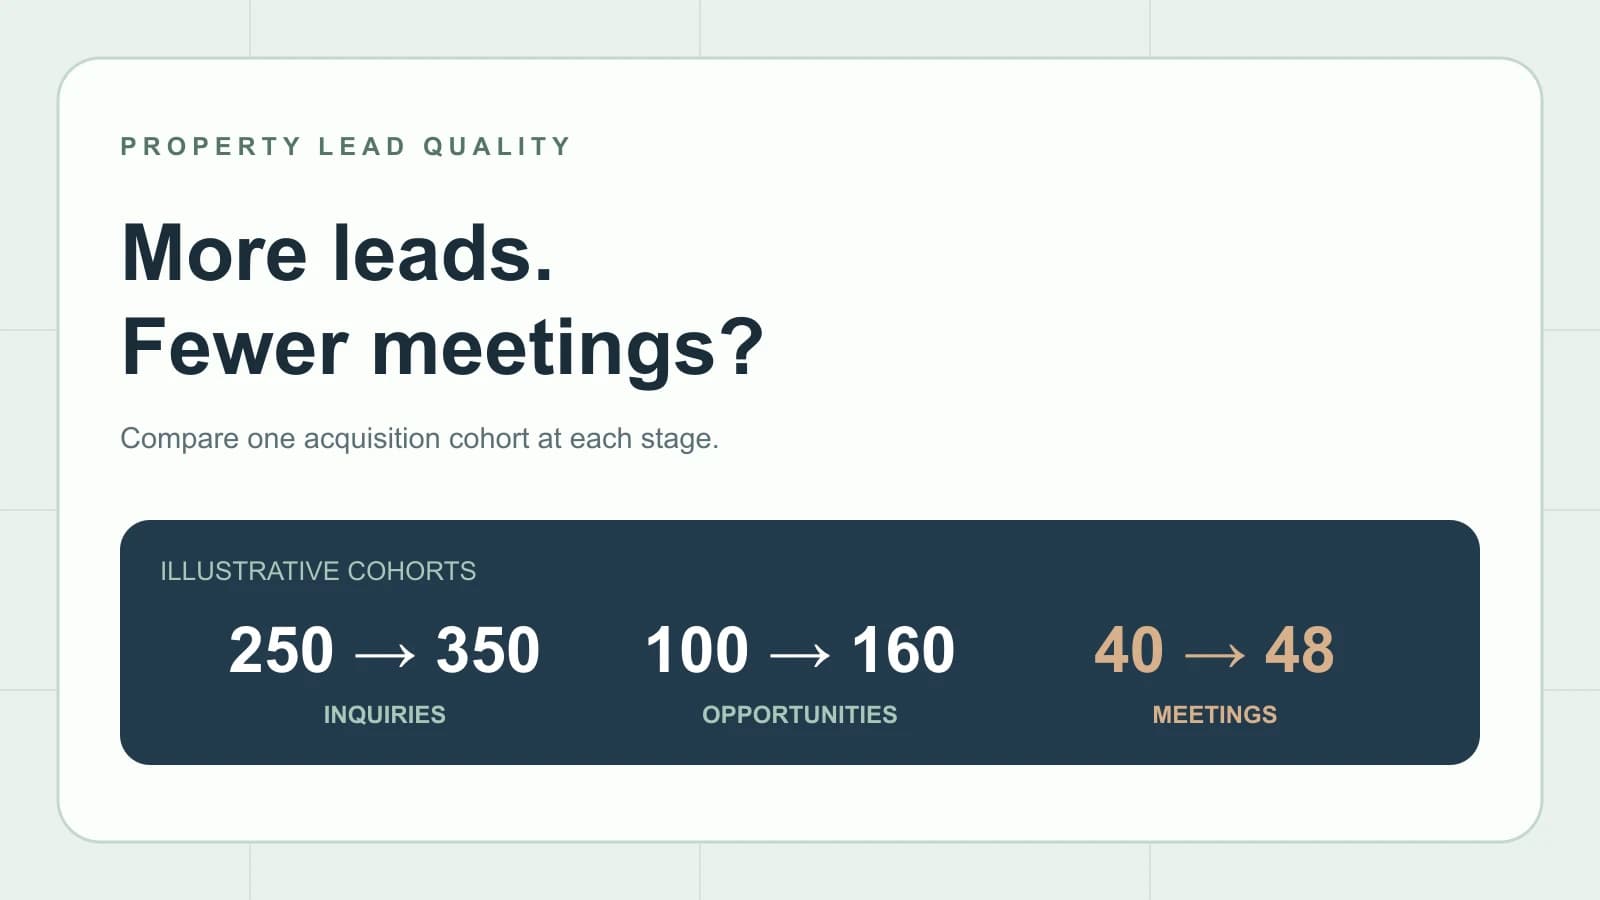
In this example, inquiries rise from 250 to 350 and qualified opportunities rise from 100 to 160. Yet spend doubles while recorded meetings rise from 40 to 48. The meeting-stage rate falls from 40% to 30%, and cost per recorded meeting rises from $125 to $208.33. Spend per qualified opportunity also rises: $50 in Month 1, about $53.85 in Month 2, and $62.50 in Month 3. Every comparison uses the stated numerator and denominator for the same acquisition cohort and a 30-day follow-up window.
The pattern identifies a question, not a cause. The extra opportunities might have different budgets, locations, or timelines. Sales capacity might be constrained. Calls could be missed, the calendar could have fewer available viewing slots, or the meeting-stage event might be recorded less consistently. A longer buying cycle could also mean that 30 days is insufficient for some cohorts. The team should inspect these explanations before reducing spend or changing targeting.
Check whether the latest cohort has had time to mature
A current-month report often combines complete spend with incomplete downstream outcomes. Google Ads explains conversion lag: recent campaign data can still change as conversions arrive. Its conversion-window guidance also shows that the configured window determines which later actions can be recorded. A CRM meeting may happen after the ad platform's reported lead event, so the two systems can have different clocks.
Choose an observation window from the actual time between inquiry and meeting, then apply that same window to each acquisition cohort. Do not compare a 30-day-old cohort with one acquired yesterday and call the difference a decline. If the newest cohort is immature, show its inquiry and opportunity counts but mark meeting ratios as provisional. A cohort table can include a maturity date so readers see when the outcome window closes. Google Analytics describes cohort analysis as grouping users by an inclusion event and examining later behavior; a CRM version should use the business's own inquiry and meeting events with their documented identities.
Investigate the gap from record to record
Start with a small sample of opportunities from each cohort. Trace the original inquiry, source and campaign fields, qualification outcome, assigned owner, contact attempts, appointment record, and stage-change timestamps. Count duplicates and records with missing stage history separately. This is more useful than taking a single dashboard percentage at face value.
Ask whether the mix changed. Did a broader audience bring more early-stage researchers? Did the form remove a qualifying question? Did one development or geography start generating a larger share of inquiries? The lead-scoring guide can help teams define fit consistently, but a score should be checked against actual conversations and meetings. A high score does not itself establish intent.
Then check the handoff. Did response time lengthen as volume increased? Were inquiries assigned to the right agent? Were appointment slots available at the times prospects requested? Were meetings booked but never recorded in the CRM? These questions require operational evidence. The lead-to-revenue system should connect acquisition, routing, follow-up, and outcomes so that each stage can be audited without guessing from a total lead count.
Finally, reconcile attribution. A person may submit a form after an ad, return organically, and book through a call. The CRM and ad platform may credit different events. Keep the source fields and event times intact, and state which attribution model was used for each report. The issue can be reporting coverage rather than a real change in customer behavior.
A decision checklist for the next reporting review
- Freeze definitions. Agree on distinct inquiry, qualified opportunity, booked meeting, attended meeting, and duplicate rules before looking at the trend.
- Choose the cohort and window. Group by inquiry date and use the same observation period for each cohort. Label newer cohorts provisional until they mature.
- Reconcile totals. Check ad spend against the platform, inquiry IDs against the CRM, and meeting records against the calendar or booking system.
- Calculate stage rates. Show the numerator, denominator, acquisition period, and observation window beside each ratio. Include the count as well as the percentage.
- Inspect exceptions. Sample missed calls, unassigned records, duplicates, poor-fit opportunities, cancellations, and late meetings. Separate missing data from confirmed non-progression.
- Choose a bounded test. If fit weakened, refine qualification or targeting. If follow-up weakened, repair ownership and response workflow. If the data is incomplete, fix tracking before claiming a performance change.
More leads can still be valuable. The point is to establish what they became, when they had enough time to progress, and what the team paid to reach the stage that matters. A consistent cohort view turns a vague argument about volume into a testable question about fit, follow-up, and recorded meetings.
FAQ
Is cost per lead enough to judge a property campaign?
No. Cost per inquiry measures initial response cost. It does not show whether inquiries fit the property offer or reach a defined meeting stage. Review downstream counts and cost per recorded meeting for the same acquisition cohort.
Should a booked viewing count as a held meeting?
No. Booking and attendance are separate events. If the report uses booked viewings, label them that way and track cancellations, no-shows, and attended meetings separately.
Why can a newer month show a lower meeting-stage rate?
Some inquiries may still be progressing. Compare cohorts after the same observation window and mark immature cohorts provisional. A lower rate in a mature cohort still needs investigation of fit, follow-up, capacity, and recording quality.
What if an inquiry arrives through more than one channel?
Keep the inquiry and its touch history, deduplicate the person under a documented rule, and apply one consistent attribution method when grouping cohorts. Do not add the same meeting to several channel totals without explaining the reporting method.
Does a falling meeting-stage rate prove the ads caused worse leads?
No. The ratio describes progression under the chosen definitions. Sales capacity, response time, available viewing slots, a changed property mix, a longer buying cycle, or missing CRM events could produce a similar pattern.